 訂閱
訂閱 上一篇
上一篇 下一篇
下一篇M. David Merrill教授的教學設計理論模型
作者: 塾長 日期: 2010-06-29 19:51


你希望看到怎樣的教學,是enervative(衰弱)、endless(無盡)、empty(空洞)的e3-LEARNING,或者是effective(效益), efficient(效率), engaging(投入)的e3-LEARNING呢?提出這樣的問題與教學設計解決方法的人,就是投身教學設計領域長達四十年的M. David Merrill教授 ,網站集結了著作、研究發表 ,也有工作坊的線上課程 喔!
之前在教育科技所就讀時,就看了他的教學設計教科書,而這回考上博士班的準備中,也看到他這篇『Reflections on a four decade search for effective, efficient and engaging instruction 』,呵呵,常說這個十年的『decade」,這回可是有四個喔~40年耶!
以下,我先整理出『他說了、做了什麼?』以圖像秀給你看,然後也整理『我學到、想到』及我們可以參考應用的核心概念。主要參考2009年這篇『Finding e3 (effective, efficient and engaging) Instruction 』,本篇是以檢核表形式來看課程與學習是否因為適當地整合教學設計與多媒體應用原則來達到effective(效益), efficient(效率), engaging(投入)的e3目標。
第一部份是多份檢核表,而利用第二部份(以下主要整理)把他自己提出的教學設計原理原則做一番補充:
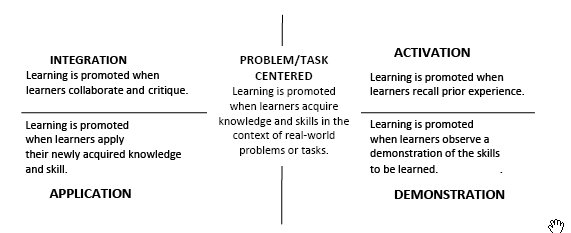
*教學的首要原則(First Principles of Instruction)
涵蓋活化(ACTIVATION)、示範(DEMONSTRATION)、整合(INTEGRATION)與應用(APPLICATION),並以中心的問題/任務導向集成(PROBLEM/TASK CENTERED)。您可以參考Gagne'的學習條件與教學事件 。
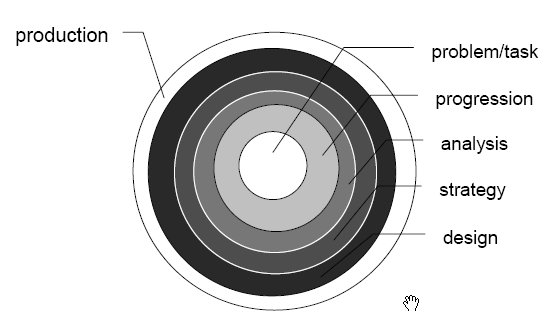
*提出『Pebble-in-the-Pond Model 』設計模式,好似石子激起的擴散波紋:
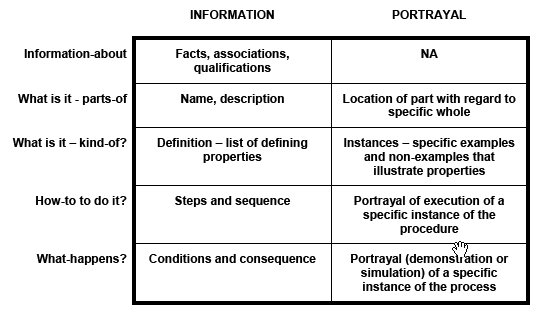
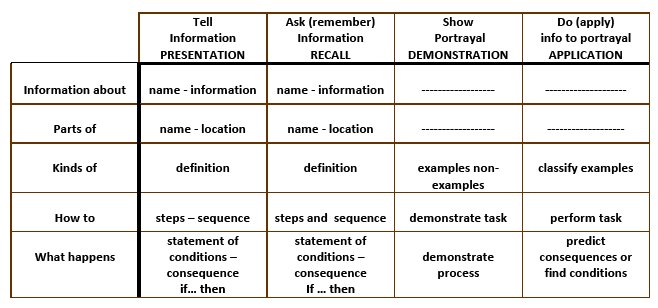
*孩子可以習得且表現的能力(Consistent Component Skills) 有五類:
關於xxx的資訊(Information-about)、由什麼組成?(What is it? -- Parts-of)、這是那一類?(What is it? --Kinds-of)、如何做?(How-to do it?)、發生了什麼事、為什麼?(What-happens -- Why?),您可以參考Bloom認知領域教育目標分類 。
*那麼,就對應著老師可以利用的教學策略(也正和首要原則的四項相符喔!):
展示資訊(Tell Information PRESENTATION)、發問與提起回憶(Ask (remember) Information RECALL)、示範樣貌(Show Portrayal DEMONSTRATION』以及行動實務(Do (apply) info to portrayal APPLICATION )
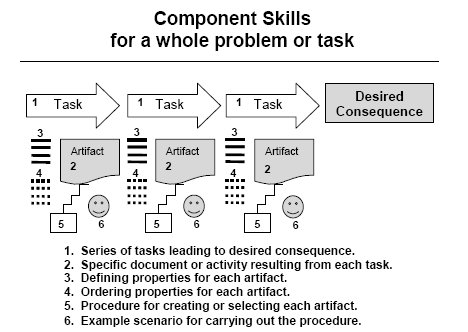
*再來是我一直想表達的那種學習中的精彩~把上述學習表現能力,從整體的問題、任務導向來看:
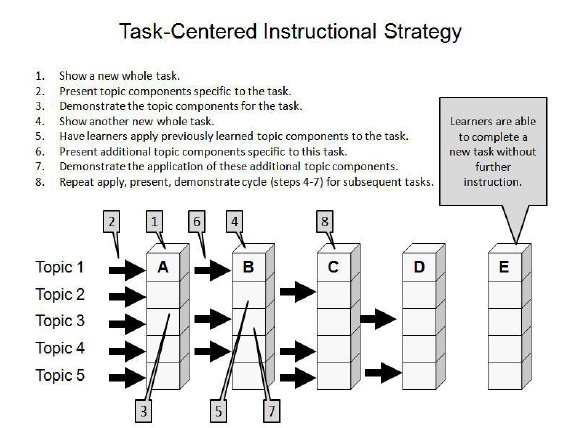
*當然,老師的教學策略整合也要發揮全功呢!
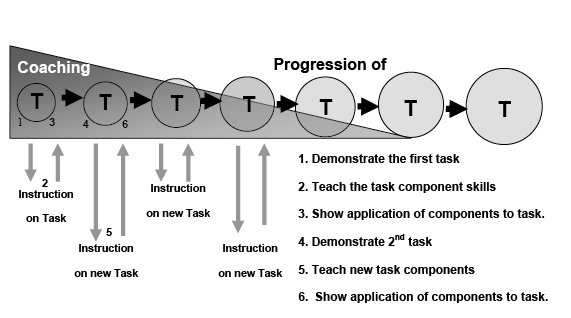
*而在整個過程中是一種漸進的任務導向教學策略之應用:
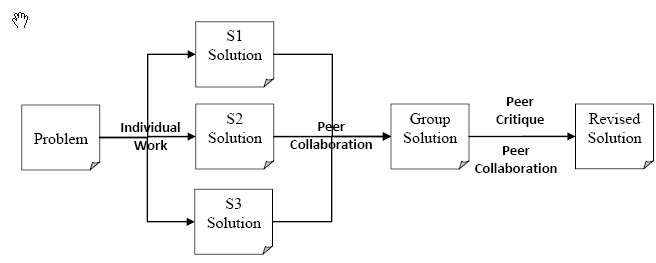
*當然,沒有少了對於同儕之間的互動進行瞭解喔!(Effective Peer Interactions)
* 另外,有效的多媒體應用原則,是參考Clark and Mayer的五大原則:
1. Use words and graphics rather than words alone. Look for:
a. Graphics and text are used to present instructional content.
b. Graphics are relevant rather than decorative.
c. Representative graphics are used to illustrate concrete facts, concepts, and their parts.
d. Animation is used to illustrate processes, procedures, and principles.
e. Organizational graphics are used to show relationships among ideas or lesson topics.
f. Interpretative illustrations such as graphs are used to show relationships among ideas or lesson topics.Graphics are used as a lesson interface for case studies.
2. Place corresponding words and graphics near each other. Look for:
a. Screens that place explanatory text adjacent to the graphic they describe.
b. Feedback that appears on the same screen as the question
c. Procedural directions that appear on the same screen in which the steps are to be applied in an exercise.
d. Linked information that does not cover related information on the primary screen.
e. Use of techniques such as pop-up text and reduced graphics that support integration of text and graphics.
3. Present words as audio narration rather than on screen text. Look for:
a. Use of audio narration to explain onscreen graphics or animations.
b. Use of text for information that learners will need as reference, such as directions to practice exercises.
4. Presenting words in both text and audio narration can hurt learning. Look for:
a. Graphics are described by words presented in the form of audio narration, not by narration and redundant text.
b. Onscreen text can be narrated when the screens do not include graphics.
c. When language is challenging, onscreen text is narrated.
5. Adding interesting material can hurt learning. Look for:
a. Lessons that DO NOT include extraneous sounds in the form of background music or unrelated environmental sounds.
b. Lessons that DO NOT use graphics and video clips that are related but not essential to the knowledge and skills to be learned.
c. Lessons that present content in lean text or narration that presents the main points.
愈看愈讓自己受到感動與鼓舞呢! 我也會再把ASSURE 做一番對應~繼續加油!

